Workday Reports and Dashboards offer real-time insights into key performance indicators, project statuses, financial metrics, and employee performance. However, each Executive’s needs differ based on their role and organisation.The key to maximising Workday’s capabilities lies in understanding the “What” and “Why” behind the required insights. Once identified, standard Workday reports and dashboards can be leveraged, and custom solutions can be created to fit specific requirements.Below are some of the most used reports and dashboards tailored for different C-Level Executives.
Office of the CEO
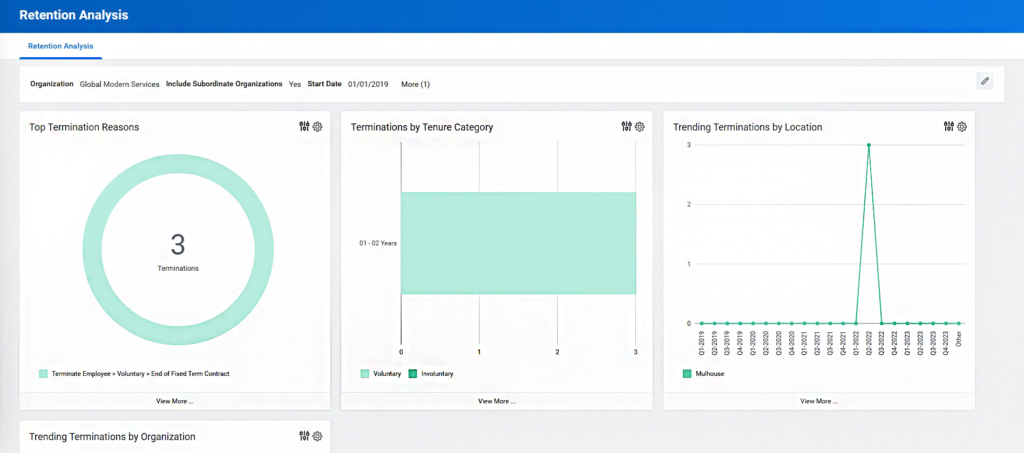
Retention Analysis Dashboard
This dashboard provides an overview of retention variables across the organisation by location and quarter. It includes:
Chart with termination reasons – Understand why employees leave.
Terminations by tenure category – Analyse trends based on employee tenure.
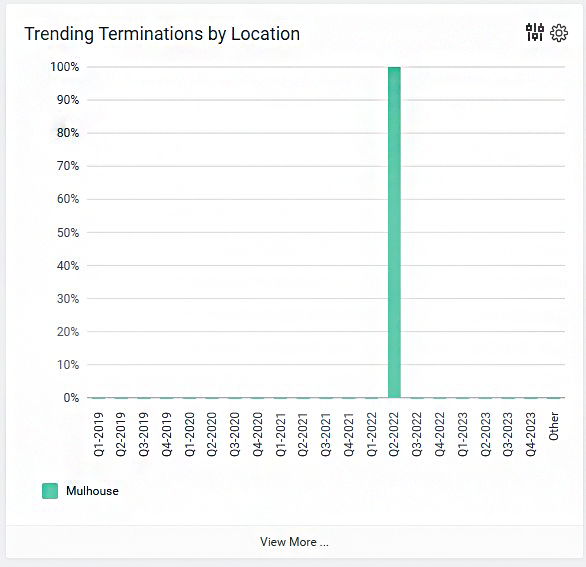
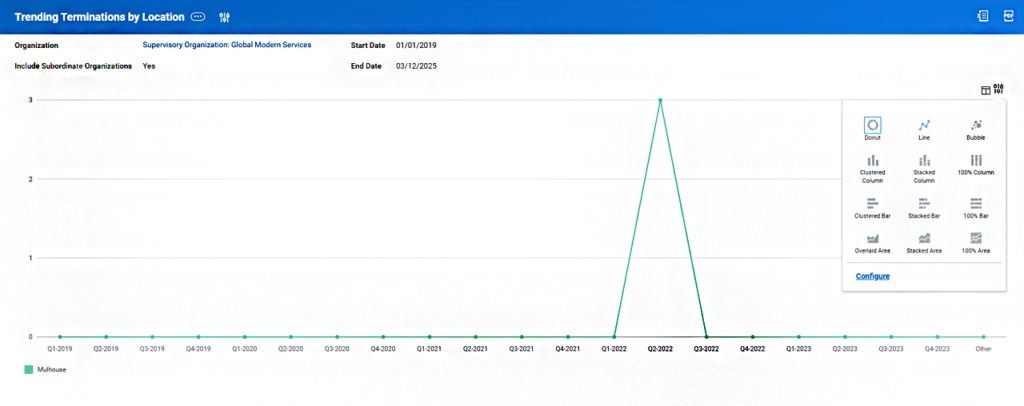
Trending terminations by location and organisation – Identify problem areas.
Executives can open this data in a table view, alongside other charts and graphs for deeper analysis.
Additionally, this dashboard can be enhanced with reports such as Terminations by Performance Rating and Quarter, offering further insights into employee departures.
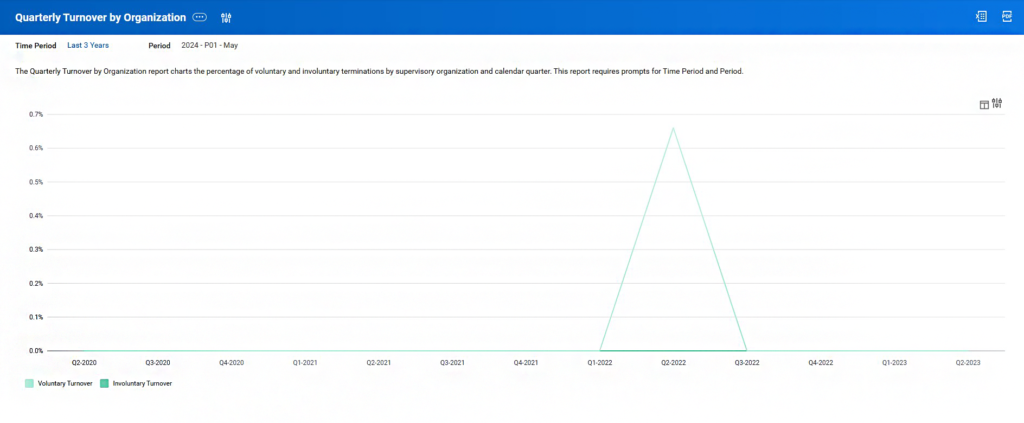
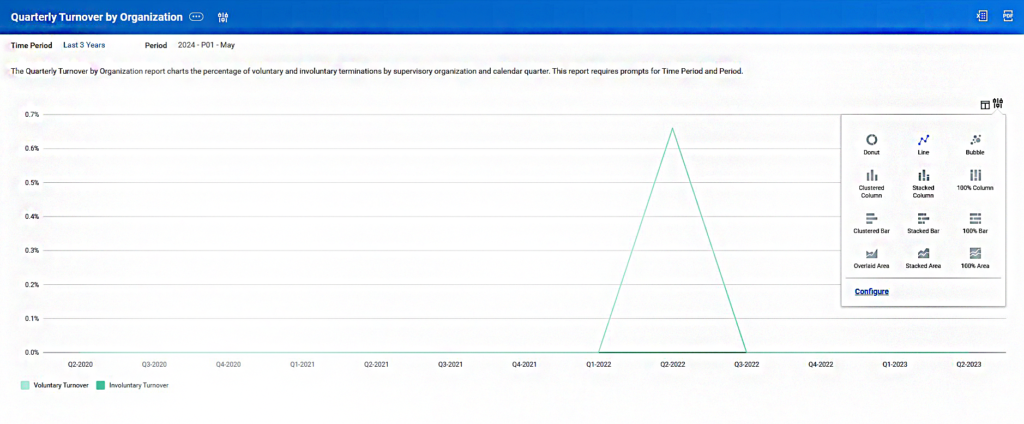
Quarterly Turnover by Organisation Report
This report charts the percentage of voluntary and involuntary terminations by supervisory organisation and calendar quarter.
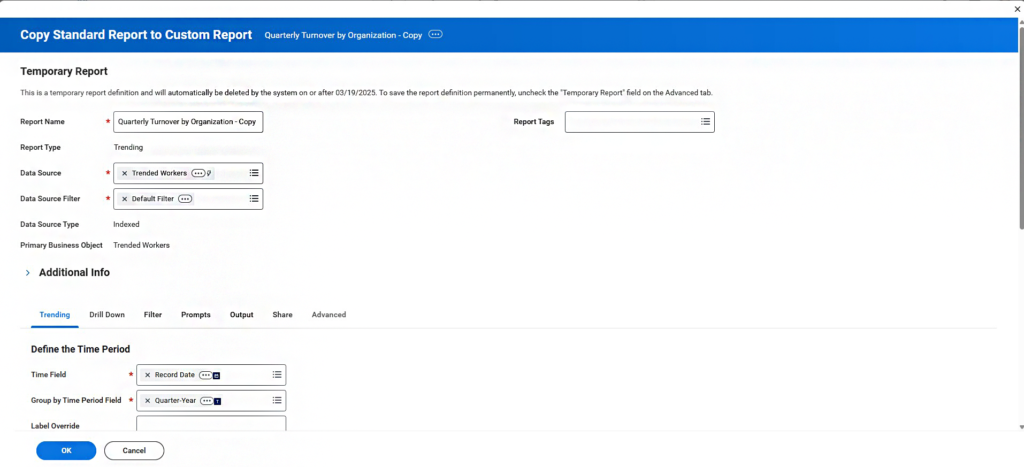
Customisable fields – Users can add additional time periods, filters, and prompts to tailor the report to their needs.
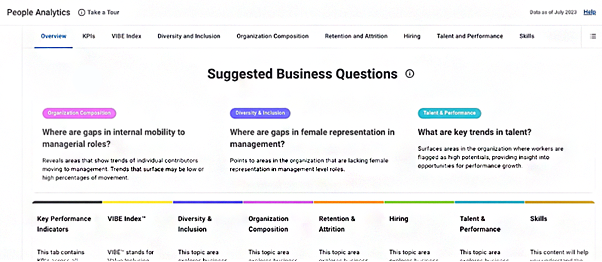
People Analytics Dashboard
Using analytics technology, this dashboard provides insights into workforce trends, helping leaders make strategic decisions. It is particularly useful in board meetings and HR business partner discussions.
Key benefits:
Identify opportunities and risks within workforce metrics.
Detect patterns that may not be immediately obvious.
Reduce manual data analysis, allowing focus on strategy.
Present workforce trends in clear, natural-language narratives.
Analytics areas covered:
Diversity & Inclusion
Organisational Composition
Retention & Attrition
Hiring
Talent & Performance
Skills
VIBE Index
Employee Sentiment
Each topic comprises 1 tab in the application UI, except Employee Sentiment, which is part of the VIBE Index tab.
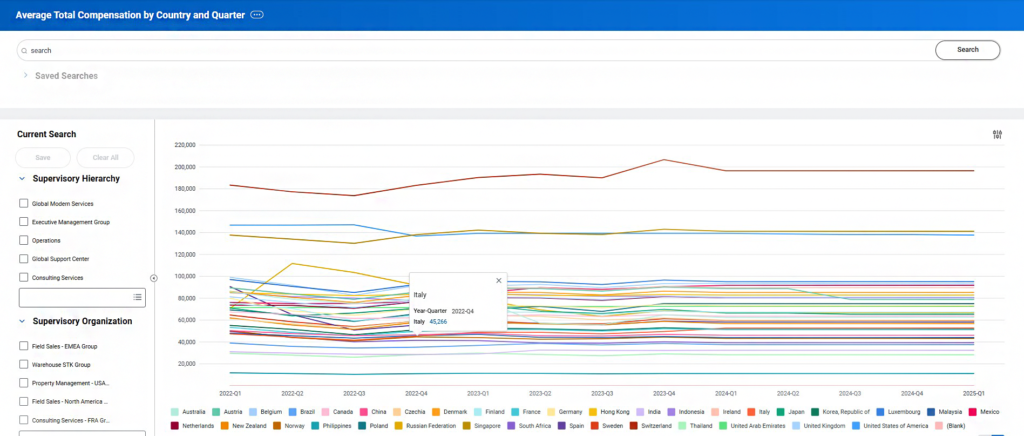
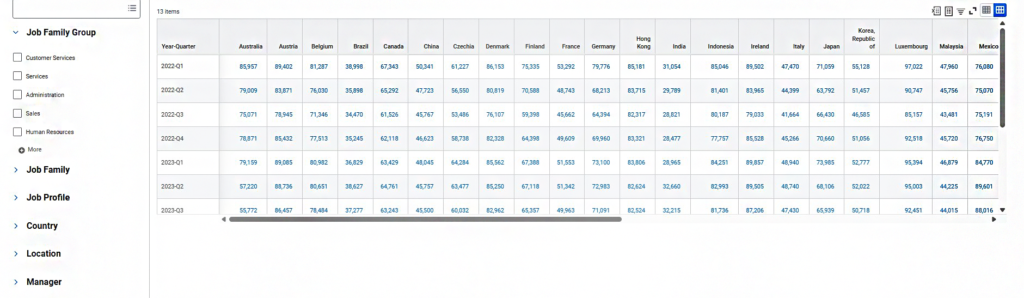
Average Total Compensation by Country and Quarter Report
This report provides compensation insights by country and quarter, displayed in both a linear graph and a table. Users can filter data by:
Supervisory Hierarchy
Job Family Group
Location
Employee Type, and more.
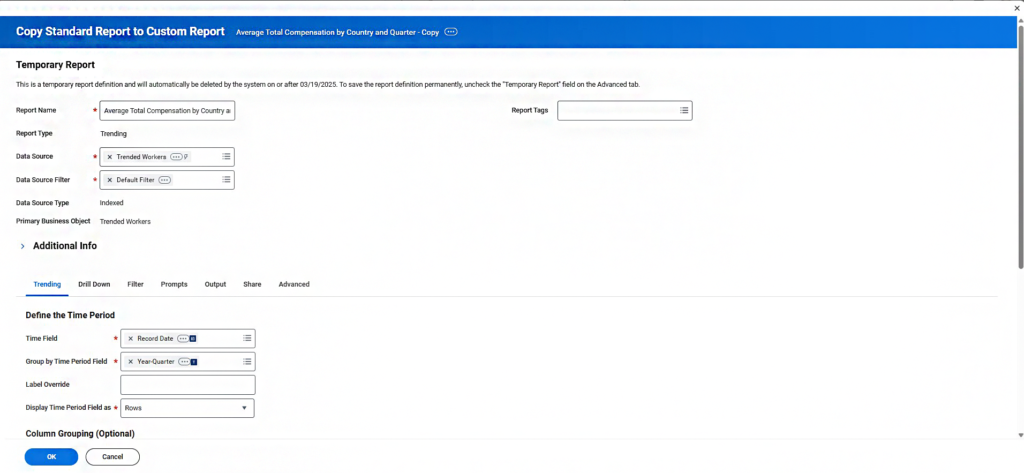
The report is customisable, allowing additional fields and prompts as needed.
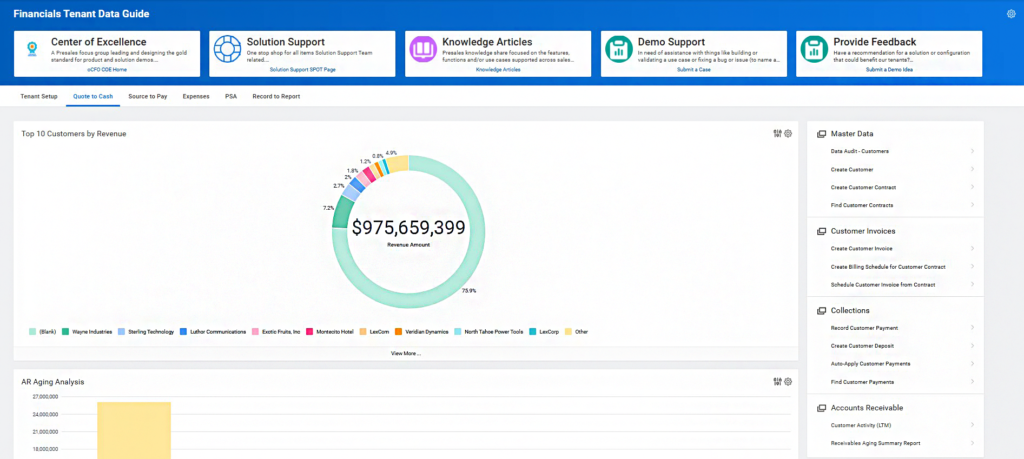
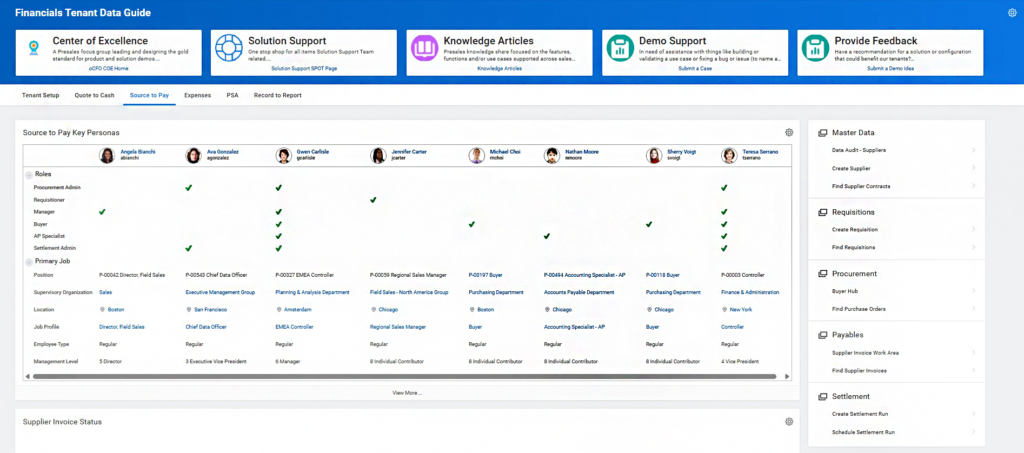
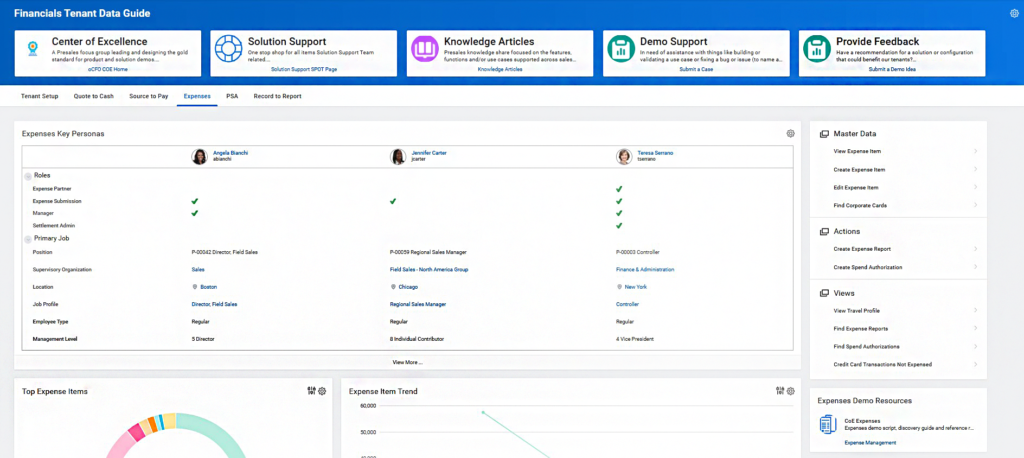
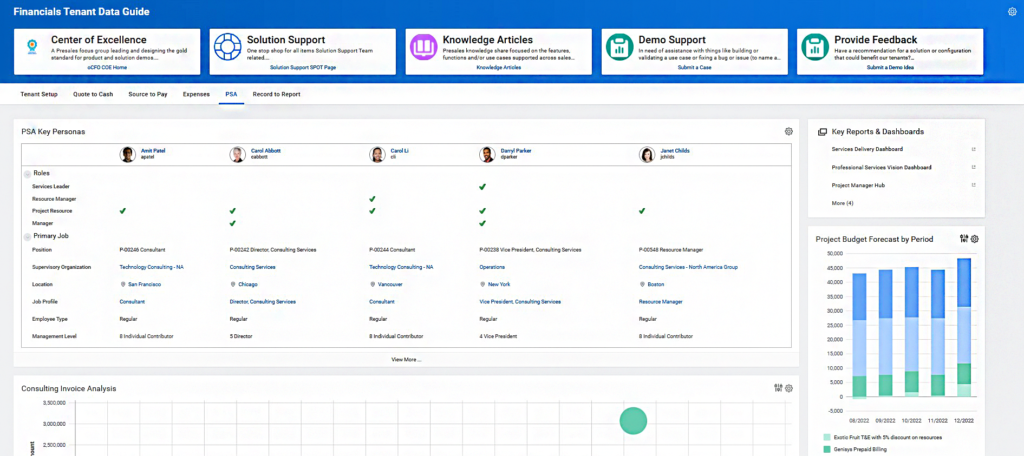
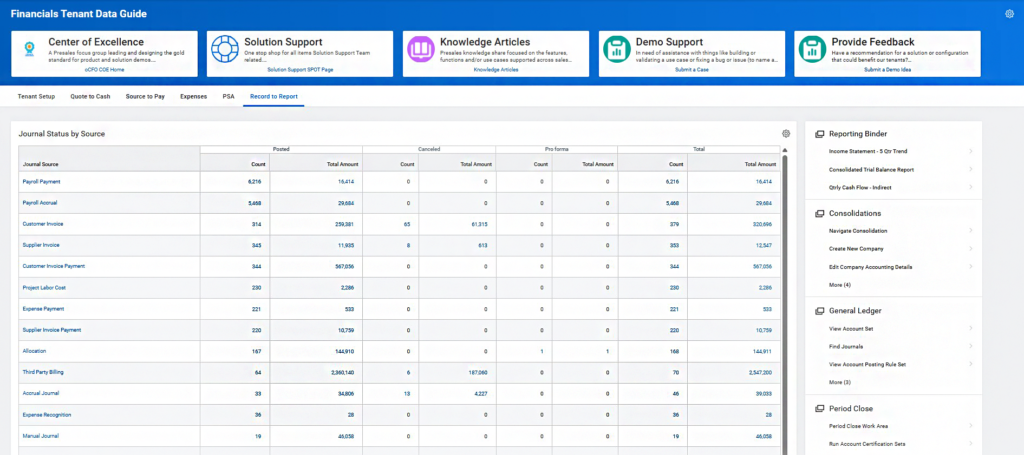
Financials Tenant Data Guide Dashboard
This dashboard provides a comprehensive view of an organisation’s financial data. The CFO can access:
Expenses and revenue planning
Pending financial business processes
Third-party billing
Cash flow insights
Additionally, the “Top Release Features & Industry Content” tab provides updates on new Workday features and key industry dashboards.
Office of the CHRO
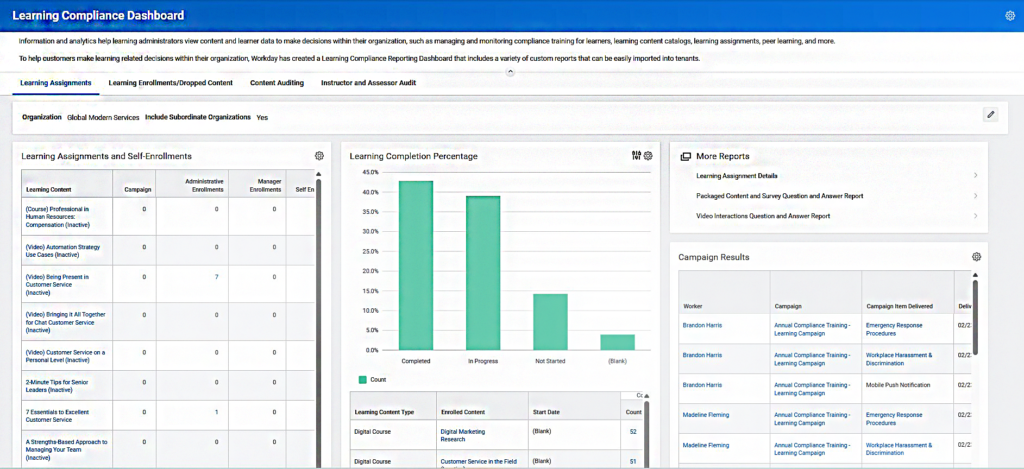
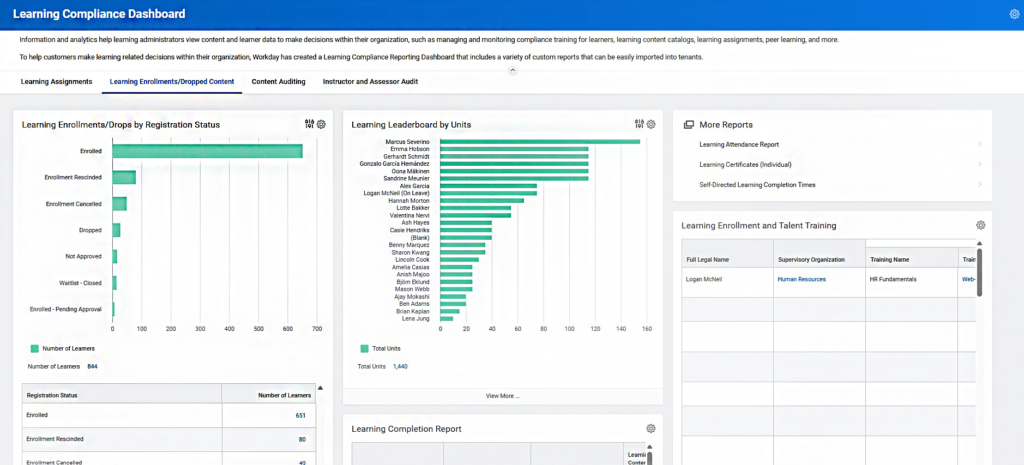
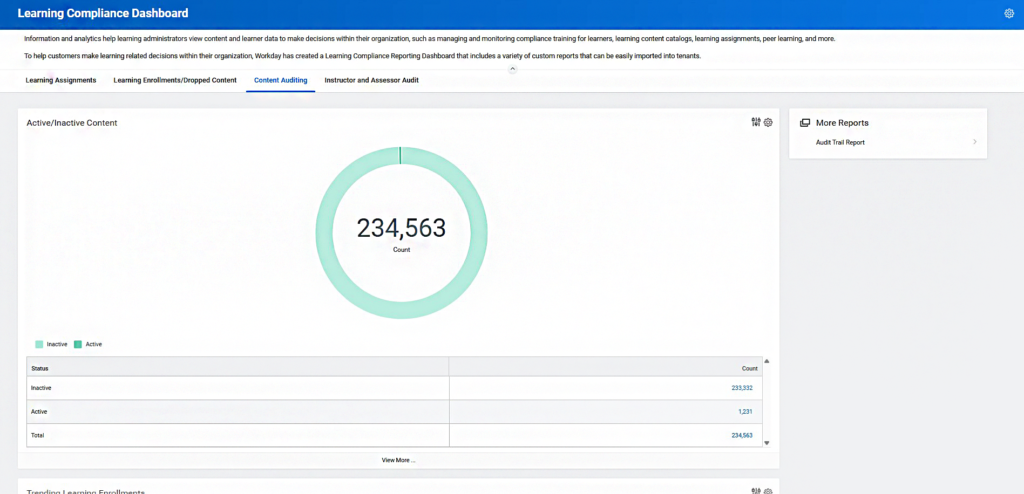
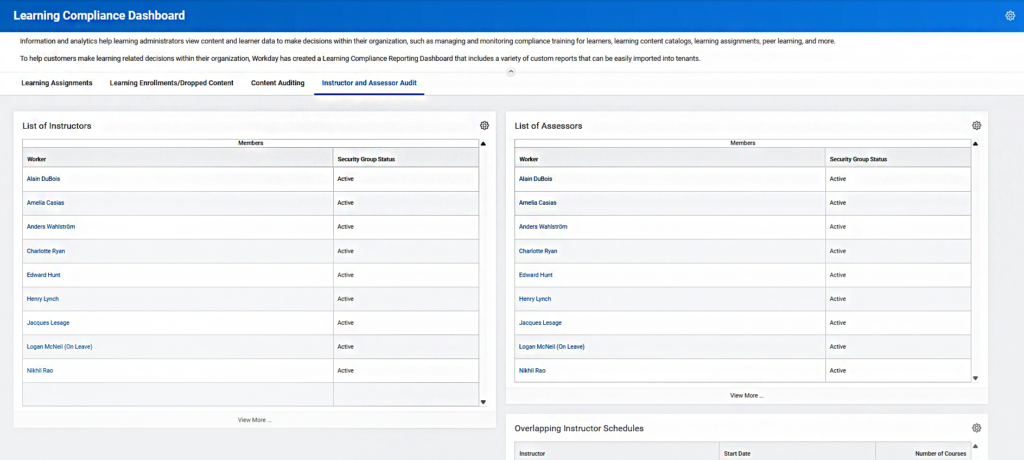
Learning Compliance Dashboard
This dashboard provides insights into compliance training, including:
Learner engagement and completion rates
Learning content catalogues
Assigned and peer learning
The CHRO can filter data for specific organisations or individuals and view insights in multiple formats (graphs, tables, custom reports). By using this Dashboard, the CHRO can have an overview of the Learning Compliance and check specific cases for different organizations or individuals.
Talent Analytics for HR Dashboard
This dashboard tracks HR metrics related to:
Performance and engagement
Skills development
Talent acquisition and retention
It also provides access to various custom reports and data pools, which can be edited to suit organisational needs.
Conclusion
Tailoring Workday Reports and Dashboards to C-Level Executives is essential to empower strategic decision-making.
Each executive, whether the CEO, CFO, or CHRO, requires unique insights to drive organisational success. Workday provides a wealth of tools that can be adapted to each company’s specific needs. However, the most critical takeaway from this guide is to first understand the “What” and “Why” before customising solutions accordingly.
By leveraging the right reports and dashboards, Executives can drive efficiency, enhance visibility, and ensure data-driven decision-making across the business.
Gain actionable insights, customise reports, and empower your leadership team with data that drives results. Contact us to transform decision-making with Workday.
Receive the latest insights on HR & Finance Tech solutions.
2026R2 release continues to strengthen Workday Adaptive Planning with enhancements to improve efficiency, increase visibility, & make informed decisions.
This website uses cookies to improve your experience while you navigate through the website. Out of these, the cookies that are categorized as necessary are stored on your browser as they are essential for the working of basic functionalities of the website. We also use third-party cookies that help us analyze and understand how you use this website. These cookies will be stored in your browser only with your consent. You also have the option to opt-out of these cookies. But opting out of some of these cookies may affect your browsing experience.
Necessary cookies are absolutely essential for the website to function properly. This category only includes cookies that ensures basic functionalities and security features of the website. These cookies do not store any personal information.
Any cookies that may not be particularly necessary for the website to function and is used specifically to collect user personal data via analytics, ads, other embedded contents are termed as non-necessary cookies. It is mandatory to procure user consent prior to running these cookies on your website.