Workday Reporting for Analysts: A Guide on How to Walk 

Table of Contents

When implementing Reporting and Dashboards in a customer’s Workday tenant, Report Writers and Analysts must consider several key factors to ensure effectiveness and success.

In addition to understanding the different needs of various positions and the management board, implementers must account for several aspects of the tool itself, including: 

  • Editing and creating custom reports and dashboards 
  • Different types of reports and dashboards 
  • Security and Compliance 
  • Best practices for performance and maintenance 
  • System requirements and user expectations 

This guide will walk you through the process of creating reports and dashboards while ensuring optimal performance and usability.

Creating Custom Reports and Dashboards

Custom reports and dashboards play a vital role in retrieving valuable information and insights tailored to customer needs.

How to Create a Custom Report?

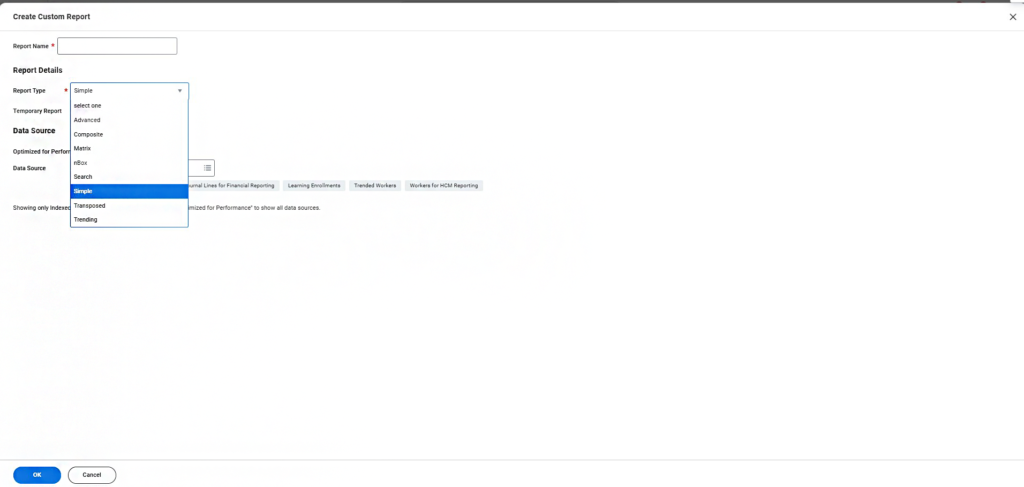
You can create a Custom Report by following these steps: 

  • Access the Create Custom Report task. 
  • Copy an existing custom report.
  • Select Custom Report > Create from the related actions menu of a Report Data Source (RDS).
How to Create a Custom Dashboard?

To create a Custom Dashboard: 

To create a Custom Dashboard: 

  • Access the Create Custom Dashboard task. 
  • While completing the task, consider the following elements: 
  1. Domains 
  2. Dashboard Icon 
  3. Dashboard Tabs 
  4. Maximum Worklets Allowed – You can add up to 6 worklets per tab, with a total of 36 worklets.
Report Types

Understanding different report types will help in selecting the most appropriate one based on the requirements.

Report Type  

Description  

Advanced 

Display fields from the primary business object and related business objects with advanced design options. Advanced report results can be displayed on charts and worklets and with multiple headings and subtotals.  

You can enable advanced reports for use as web services in outbound EIBs.  

Composite 

Combine multiple reports into 1 report. Each sub-report can have a different report data source.  

Matrix 

Group and summarize data by 1 or 2 fields that contain repeating values.  

You can display matrix results in a chart or table that you can drill down on for additional details. This enables you to perform custom analytics and interactive reporting across dimensions.  

Matrix reports are similar to pivot tables and crosstabs.  

nBox 

Display counts of business object instances in a 2-dimensional matrix, enabling you to compare and visualize objects across 2 fields.  

Search 

Display instances of a business object that you can narrow down with facet filters or search terms.  

You can enable search reports for use as web services in outbound EIBs.  

Simple 

Display fields from the primary business object with basic and limited design options, such as filtering and sorting.  

Transposed 

Compare and analyse data by swapping rows for columns.  

Trending 

Group data by time for trend analysis. You can also group, summarize, and drill down on data.  

Community link:


Performance Limitations

Several factors can impact report performance. Here’s how to optimise it effectively: 

Choose the Right Data Source 

The Data Source Type has the most significant impact on report performance. Indexed data sources leverage the performance framework for speed but may not include all required fields. Use the Data Sources report to help select the most appropriate data source. 

Ensure Proper End-User Security 

Make sure the final user has access to the required data source and fields. Unconstrained security groups return results faster. 

Optimise Report Filters 
  • Filters are one of the most resource-intensive operations. 
  • Use Workday-delivered data source prompts and data source filters whenever possible. 
  • Structure filters so that the top-most filter is the most limiting, reducing the number of results early. 
Minimise Fields Used 
  • Include only necessary fields in the report. 
  • Prioritise indexed fields and avoid excessive use of calculated fields. 
  • If using calculated fields, optimise them to minimise performance impact. 
Limit Sorting Operations 

Avoid multiple sort conditions and limit sorting for large datasets. 

Community link: 

Conclusion 

The successful implementation of Workday Reporting and Dashboards depends on several factors, including: 

  • Aligning customer requirements with tool capabilities 
  • Choosing the right report type for specific insights 
  • Optimising performance for efficiency 
  • Following best practices to ensure maintainability 

By leveraging Workday features effectively, Report Writers and Analysts can deliver high-impact solutions that meet organisational needs. 

Contact us for more tips and training on optimising your Workday reports and dashboards!

Receive the latest insights on HR & Finance Tech solutions.

    More insights on this...

    Understand the typical Workday implementation timeline, from planning to go-live, and learn how to keep your project on schedule.
    Workday go-live is just the beginning. Learn how post-go-live support, Hypercare, Workday AMS, and continuous optimization maximise ROI.
    Use this Workday Go-Live Checklist to validate deployment readiness, testing, data, integrations, user training, and cutover planning before launch.
    Achieving ISO 27001 Certification reinforces our commitment to information security, operational excellence and client confidence.
    How to hire effectively in a remote company: lessons learned, common challenges, and proven hiring strategies.
    Avoid common Workday staffing mistakes by aligning capabilities with project phases. A practical guide for smoother project delivery.